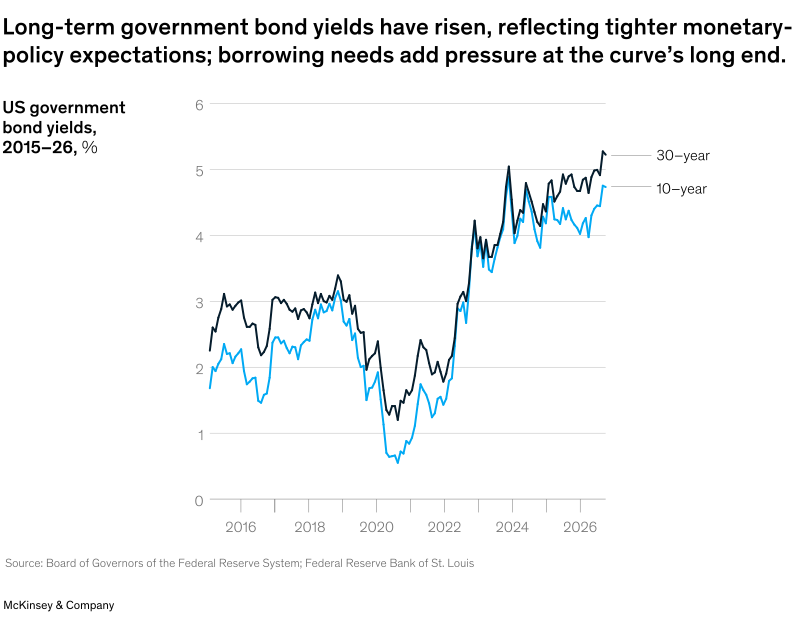
Rising levels of public debt around the world and the need for growth are significant talking points among economists and policymakers. Speaking at the G20 Finance Ministers and Central Bank Governors Meeting in Asheville, North Carolina, on September 1, International Monetary Fund (IMF) Managing Director Kristalina Georgieva emphasized the importance of lifting potential growth worldwide. She said: “The global economy has absorbed the impact of the energy supply shock better than expected, through the use of oil and gas reserves, new sources of energy, and demand management measures. Surging AI investment—including in power projects to satisfy energy needs—is driving growth, in the US in particular, and in other economies integrated into the AI value chain, such as Korea. But behind the averages there is significant divergence in economic fortunes and risks to the outlook remain high.” She also noted that public debt is at almost 100 percent of GDP worldwide and is set to climb further, while the disinflation process has stalled in many countries. “Mounting fiscal pressures are pushing core bond yields upward and the interplay between fiscal and monetary policy worries markets,” Georgieva added (Exhibit 1).1
In the United States, total public debt hit $40.0 trillion for the first time on August 18, 2026, reaching $40.1 trillion by August 28. It has grown by about $1 trillion every four months since breaching $37 trillion in August 2025. Net interest is now the federal government’s second-largest expense at $963 billion over the first ten months of fiscal year 2026—a 14% rise. The ten-month deficit of $1.80 trillion already exceeds the $1.78 trillion recorded for the whole of fiscal year 2025.
Inflation increased across the major advanced economies, while stronger producer prices are signaling renewed upstream cost pressures. In the US, the Consumer Price Index (CPI) was up 3.4% year over year in July, after rising 3.5% in June. Core inflation rose 2.5% (annualized). In July, median inflation expectations decreased by 0.1 percentage points to 3.6% at the one-year horizon and remained unchanged at the three- and five-year horizons—at 3.3% and 3.0%, respectively. The eurozone’s Harmonised Index of Consumer Prices (HICP) fell to 2.8% year on year in June, down from 3.2% in May, the first meaningful deceleration since the Middle East energy shock took hold earlier this year. However, a resurgence of tensions in the Strait of Hormuz in mid-July represents a renewed upside risk. In the UK, the inflation picture became less favorable during the summer. Headline consumer price index (CPI) inflation rose from 2.9% in July to 3.1% in August.
Among emerging economies, the picture is more divergent, but with only China experiencing low inflation. China’s headline inflation dropped to 0.5% in July 2026 from June’s 1.0%, leaving consumer inflation barely positive and far below the government’s approximate 3.0% ceiling; core inflation (excluding food and energy) stood at 0.9%. A year ago, inflation sat at 0%, underscoring how persistent the demand shortfall has been. Producer prices, by contrast, are firming: the producer price index (PPI) registered 3.5% in July 2026, down from 4.1% in the prior month but nevertheless showing a marked upswing from the –3.6% of a year ago—presenting an early indication that factory gate deflation is receding even as margins stay thin.
India’s retail inflation firmed to 4.45% in July, from 4.38% in June, with food inflation (CFPI) firming to 5.52%, from 5.32%, as a weaker monsoon lifted some vegetable prices. In Brazil, inflation was down in June, touching 4.44% (4.64% in May), below the central bank’s upper target limit of 4.50%. In Mexico, too, inflation was lower, declining to 3.1% in July from 3.4% in June. In contrast, Russia’s consumer price inflation accelerated slightly in June and July, with prices up 6% annually. Much of the inflation increase reflected a fuel supply crisis caused by drone strikes—June’s daily processing of crude was 30% below May’s levels, and fuel prices soared by roughly 20%.
Eurozone GDP growth for the second quarter of 2026 was revised up to 0.6% quarter on quarter (+1.2% year on year). Net exports provided the dominant impulse (+0.9 percentage points), and household consumption added 0.2 percentage points, while inventories subtracted 0.5 percentage points. Real GDP in the United Kingdom rose 0.4% quarter on quarter in the second quarter of 2026, slowing from 0.6% in the first quarter, yet indicating greater resilience than the subdued year-over-year rate alone would suggest. Growth was primarily driven by services (+0.5%), notably information and communication, and professional services.
In Russia, preliminary GDP figures recorded 1.3% of annual growth in the second quarter—a recovery in economic activity following a weak first quarter, which saw a GDP contraction of 0.2% annually and 0.6% versus the fourth quarter of 2025. Industrial output, up 0.4% annually in January–June, contributed strongly to growth, which came almost exclusively from the manufacturing sector, specifically serving the military-industrial complex. Production interruptions caused by Ukrainian drone strikes were distinctly reflected in the decline in the production of coke and petroleum products.
Globally, consumer confidence has remained subdued, with households still cautious amid inflation fears. Meanwhile, spending growth is following divergent paths: strong in Russia, the United Kingdom, and the United States, but weak across the remaining surveyed economies. July’s retail and food services sales for the United States (adjusted for seasonal variation and holiday and trading-day differences) reached $763.6 billion, down 0.6% from June’s revised $768.1 billion. The Consumer Confidence Index (Conference Board) edged down to 89.4 in August from a downwardly revised 90.2 in July. In Brazil, consumer confidence stayed below the neutral 100 mark, with FGV’s (Fundação Getulio Vargas’s) seasonally adjusted July reading moving down to 88.2. Meanwhile, business confidence declined to 91.3; construction confidence improved to 92.5. Consumer activity in Russia remained healthy, with retail sales growing by 5.4% annually, despite real disposable income growth slowing to 1.5% in the first half of 2026, from 7.0% in 2025.
Persistent inflation kept interest rates high in Brazil and Russia, but weaker price and demand pressures are allowing substantially lower rates in China and the eurozone. On August 5, the Banco Central do Brasil’s Monetary Policy Committee (Copom) cut the Selic rate by 25 basis points, bringing it to 14.0%. By contrast, the European Central Bank Governing Council raised all three key interest rates by 25 basis points on September 10, bringing the deposit facility to 2.50%—the second hike of 2026—citing the August inflation surge. Six days later, the Federal Open Market Committee in the US decided by a 12–0 vote to raise the target range for the federal funds rate by 0.25 percentage points to 3.75–4%.
Global business activity strengthened in August, with services growth outpacing manufacturing. Manufacturing expanded in most major economies, but Brazil moved deeper into contraction. In the US, the industrial production index remained steady at 103 in July. The S&P Global US Manufacturing PMI (purchasing managers’ index) eased to 53.2 in August 2026, from 53.9 in July, with growth at its weakest since March. India’s manufacturing PMI slipped for a third consecutive month to 52.9—amid its weakest factory production and new order readings in five years.
Services growth broadened in August, led by the United States, India, and the United Kingdom, while most other economies recorded modest expansion; activity contracted in Russia and Brazil. The US services PMI expanded strongly, rising to 56.8 in August from the previous month’s 54.6. The HSBC Flash India Composite PMI edged up to 54.6 in August from July’s 52-month low of 54.3, a faster yet still subdued expansion and the second weakest since March 2022. Services drove the improvement, reaccelerating from July’s 53-month low.
Looking at employment, we see that US total nonfarm payroll employment increased by 162,000 in August, while the unemployment rate was unchanged at 4.1%. Employment increased in food services, drinking places, and local government education. This represents the strongest level of job gains since March.
Equity markets mostly advanced in August as expectations of continued earnings growth outweighed geopolitical concerns. On the US markets, August saw the S&P 500 rise 2.7%, bringing the one-year return to approximately 20.4%; the Dow Jones climbed 1.5% over the month and posted approximately an 18.6% one-year return. August’s CBOE Volatility Index increased to 16.3 (after rising to 16.0 in July). However, low equity volatility was in contrast with elevated oil market volatility during August. At the same time, government bond yields rose across most major economies, as inflation and fiscal concerns increased premiums, keeping long-term financing conditions restrictive. On August 19, the US Treasury announced it would at least double the size of its buyback operations in the ten-to-30-year sector, from $2 billion to at least $4 billion, after the 30-year yield hit a 19-year high above 5.3%. The long bond fell about nine basis points to 5.2% on the announcement, but yields erased the decline within 24 hours.
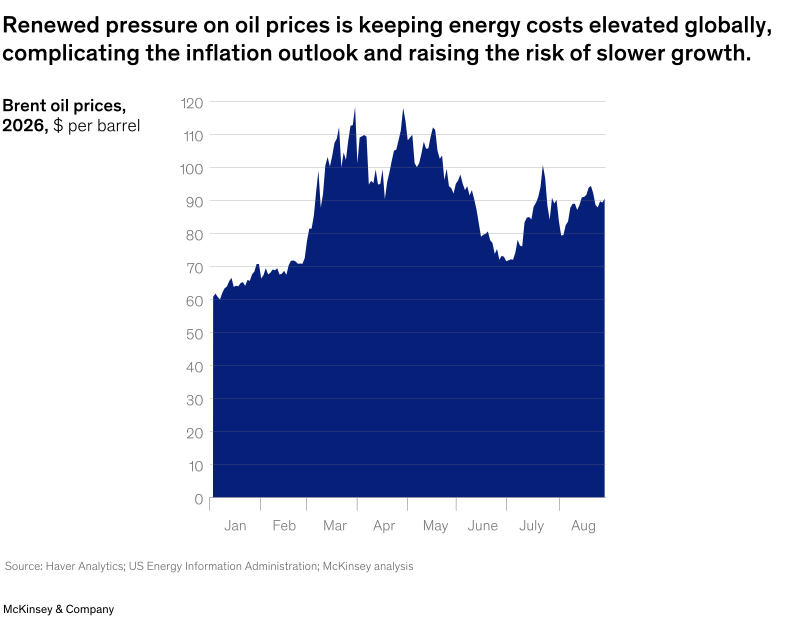
On the commodities markets, precious metals have remained historically high while energy and agricultural prices have shown greater volatility. Gold recovered in August, with prices close to record levels in response to geopolitical uncertainty, fiscal concerns, and central bank demand. The situation with industrial metals is somewhat different: copper and aluminum prices strengthened on supply constraints and demand from power grids and data center investment, while weaker nickel prices point to uneven traditional industrial demand. Energy supplies remain a source of uncertainty, with oil and European gas prices rising on concerns around geopolitical disruption (Exhibit 2). Global food prices increased further, led by vegetable oils, raising affordability risks for lower-income economies.
Export growth remained uneven across major surveyed economies, led by Mexico, China, and the United States. Meanwhile, import demand diverged sharply in the first half of the year, led by China and Mexico, as US imports normalized. Global container throughput held steady in July, with throughput in ports outside China strengthening but declining at China’s ports. However, container freight rates from China diverged in August, rising on US routes and easing on European routes. US-to-China outbound freight rates rose further in July but remained below last year’s peaks. Overall, global supply chain pressures eased in July but remained above historical norms.
Against a backdrop of continuing trade uncertainty, countries are increasingly seeking bilateral and bespoke agreements with trading partners. For example, India and Singapore held a series of high-level bilateral and business engagements in Singapore on August 20. Then, at a bilateral meeting in Tokyo on August 25, India and Japan agreed to accelerate a review of the Comprehensive Economic Partnership Agreement (CEPA). This ran alongside a roundtable on AI and semiconductors for Japanese and Indian industries that underlined growing cooperation between the countries in these sunrise sectors and other emerging industries.
Meanwhile, on July 1, the United States declined to automatically extend the United States–Mexico–Canada Agreement (USMCA) for another 16 years, prompting annual joint reviews until parties agree on an extension or the agreement reaches its final expiration in 2036. A key point of contention remains US tariffs on automobiles, steel, and aluminum. Mexico has specifically sought lower tariffs on Mexican vehicles, broader duty-free treatment for Mexican auto parts, relief from steel and aluminum tariffs, and a commitment to avoid additional tariffs while the review is ongoing. The US continues to push for stricter rules of origin, higher North American content, and stronger economic security provisions, which remain under discussion ahead of the next round.
In the US, the monthly deficit was down 5.6% to $73.3 billion: June exports reached $314.7 billion, down $2.9 billion from May, while imports hit $388.0 billion, $7.3 billion less than in May. The eurozone’s export surge that drove the second quarter’s GDP increase carried into July, with the goods trade surplus widening to €14.2 billion, from €8.6 billion in June and surpassing the €10.7 billion in July 2025. Meanwhile, India’s merchandise exports were up 19.63% year on year to $44.24 billion in July 2026, while imports grew 17.52% to $76.22 billion; consequently, this pushed the trade deficit to a six-month high of $31.98 billion as the Middle East war drove up oil import costs and freight rates. Brazil’s July trade balance recorded a surplus of $7.0 billion, down from $9.4 billion in June.
McKinsey’s Global Economics Intelligence (GEI) provides macroeconomic data and analysis of the world economy. Each monthly release includes an executive summary on global critical trends and risks, as well as focused insights on the latest national and regional developments. View the full report for August 2026 here. Detailed visualized data for the global economy, with focused reports on selected individual economies, are also provided as PDF downloads on McKinsey.com. The reports are available free to email subscribers and through the McKinsey Insights app. To add a name to our subscriber list, click here. GEI is a joint project of McKinsey’s Strategy & Corporate Finance Practice and the McKinsey Global Institute.
ABOUT THE AUTHOR(S)
Arvind Govindarajan is a partner in McKinsey’s Boston office, where Krzysztof Kwiatkowski is a capabilities and insights expert; Shubham Singhal is a senior partner in the Detroit office; Sven Smit is a senior partner emeritus and senior adviser in the Amsterdam office; and Jeffrey Condon is a senior knowledge expert in the Atlanta office.
The authors wish to thank Nick de Cent, as well as Alejandro Morales, Beatriz Oliveira, Erik Rong, Frances Matamoros, Gabriel Marini, José Álvares, Roman Büschgens, Sebastian Vargas, Sofía Córdoba, Tomasz Mataczynski, Valeria Valverde, and Vanshika Tandon for their contributions to this article.
The invasion of Ukraine continues to have deep human, as well as social and economic, impact across countries and sectors. The implications of the invasion are rapidly evolving and are inherently uncertain. As a result, this document and the data and analysis it sets out should be treated as a best-efforts perspective at a specific point in time, which seeks to help inform discussion and decisions taken by leaders of relevant organizations. The document does not set out economic or geopolitical forecasts and should not be treated as doing so. It also does not provide legal analysis, including but not limited to legal advice on sanctions or export control issues.
Global Economics Intelligence executive summary, July 2026
In recent months, the ongoing geopolitical ambiguity and economic volatility engendered by the tensions in the Middle East have understandably exercised the minds of headline writers around the world. In the spring, the price of Brent crude peaked at just over $118 a barrel and has since eased, stabilizing at around $80 per barrel—although the balance remains fragile and vulnerable to renewed volatility. Higher energy costs inevitably affect food, manufacturing, and transport costs, threatening an unwelcome combination of rising headline inflation and depressed economic growth, which in turn sap consumer sentiment and business confidence.
Yet, looking at today’s macroeconomic situation, we see that inflation has moderated slightly across key developed economies due to lower oil prices, with market-based inflation expectations also easing and returning to roughly preconflict levels—although recent developments in the Gulf are likely to push them up again in the coming months. The US consumer price index (CPI) was up 3.5% year over year in June, after rising 4.3% in May. Core inflation rose 2.6% (annualized). In June, median inflation expectations at the one-year-ahead horizon increased to 3.7% and to 3.3% at the three-year-ahead horizon—the highest level since June 2022. In the UK, inflation delivered a downside surprise. Headline CPI moderated to 2.6% in June from 2.8%, while services inflation eased to 3.6%; core CPI, however, was sticky at 2.6%.
In contrast, inflation accelerated across most major emerging economies, with China a clear outlier as weak price pressures persist. Indeed, consumer inflation in China remains unusually subdued, with headline and core CPI increases at around 1%, pointing to limited pricing power and still-cautious domestic demand. Producer prices, by contrast, have recovered materially from last year’s deflation, suggesting that conditions on the production side are normalizing faster than they are for households. Meanwhile, India’s retail inflation in June remained within the Reserve Bank of India’s (RBI) 2.0–6.0% band, but surpassed its 4.0% midpoint target for the first time since January 2025; core inflation was estimated at 3.9%. CPI inflation for 2026–27 is projected at 5.1%, with core inflation projected at 4.7%.
Growth has been affected by the Middle East conflict (Exhibit 1). In the US, real GDP increased at a 1.5% annualized rate in the second quarter, slowing from 2.1% in the first. This reflected a downturn in government spending and decelerations in investment and exports that were partly offset by an acceleration in consumer spending. Imports rose more in the second quarter than in the first. In the UK, monthly GDP rose 0.1% in May, with services growth of 0.3% offsetting declines in production (–0.5%) and construction (–0.8%).
Global growth remains mixed, with momentum softening across some major economies while pockets of resilience persist.
Note: Each panel highlights one economy in blue; the gray lines repeat all 8 economies in every panel for comparison. Economies are ordered by latest available growth, highest first. India and Brazil are shown through Q1 2026; Q2 2026 estimates were not yet available.
1Early real GDP growth estimate.

At the same time, consumer confidence remains subdued—largely a reflection of global geopolitical and economic uncertainty—although it has improved in the US. June’s retail and food services sales (adjusted for seasonal variation and holiday and trading-day differences) reached $768.6 billion, up 0.2% from May’s revised $766.9 billion. The Consumer Confidence Index (Conference Board) edged up to 91.2 in June from a downwardly revised 90.6 in May. And in the UK, household spending showed signs of resilience. Retail sales volumes rose 1.0% in June—above expectations—and were up 4.2% from a year earlier, while volumes increased 0.6% over the second quarter.
Given these mixed signals, most central banks are continuing with their wait-and-see approach. In July, Russia’s central bank was the only major central bank to cut rates, while others continue to hold as they assess the situation.
June’s activity indicators find both the global manufacturing and services sectors still in expansion territory, with manufacturing growth holding. However, signs of moderation are emerging as the earlier boost is fading. Russia and Brazil both expanded, while the US remains resilient, with the industrial production index edging up to 102.6. Notably, S&P’s manufacturing purchasing managers’ index (PMI) for the US was revised up slightly to 53.9 in July (matching June), signaling another month of solid expansion. In the eurozone, business activity signals are mixed but improving at the margin. The S&P Global Eurozone Composite PMI was revised up to 50.0 in June, signaling stable private sector output, with manufacturing in expansion at 51.4 for a fifth consecutive month. However, industrial production declined 0.2% month over month in May, reversing April’s modest gain.
Services activity is expanding much faster in emerging markets than in developed economies, primarily due to strong growth in China and India. In the eurozone, the services PMI edged up to 49.4—just below expansion.
Looking at employment, we see that US nonfarm payroll employment rose by 57,000 in June. Employment continued to trend up in professional and business services, social assistance, and healthcare. Leisure and hospitality lost jobs. Unemployment dropped slightly to 4.2%.
July saw some stabilization across financial markets; Russia remains the notable exception with domestic equities deteriorating further. In the US, the S&P 500 was down 0.1% in July, bringing the one-year return to approximately 19.6%; the Dow Jones climbed 0.3% over the month and posted a one-year return of approximately 18.9%. July’s CBOE Volatility Index edged down to 16.0 (after rising to 16.3 in June). Volatility in oil contracts spiked in early August, although the increase was more contained than at the onset of the Middle East conflict. The cost of capital increased across most countries, reflecting growing concerns over inflation and the growth outlook.
Commodity trends have seen gold and livestock heading lower, while energy prices remain elevated despite easing from last month’s levels. The downward trend in gold prices extended into August, dropping to around $4,100 per ounce. It’s a more divergent picture for base metals, with copper rallying while aluminum gave back its war premium. Overall, food prices remained broadly stable despite a recent surge in vegetable oil prices, with declines across other food commodities offsetting this increase.
Turning to trade, we see that supply chain pressures continued to be elevated into the summer (Exhibit 2), while global export momentum remained uneven in early 2026, with strong growth in China, Mexico, and the US. Import trends tell a different story, with a divergence in early 2026: Imports to China, India, and Mexico grew, while US imports normalized from 2025 highs. US exports in June reached $314.7 billion, down $2.9 billion from May’s figure, with imports at $388.0 billion, $7.3 billion less than in May. The monthly deficit fell 5.6% to $73.3 billion. By contrast, the eurozone experienced a sharp deterioration in its goods trade balance, recording a €7.8 billion deficit in May 2026—a dramatic worsening from the €1.0 billion deficit in April, driven by a 10% year-over-year surge in energy imports with export volumes broadly flat versus May 2025.
Global supply chain pressures remained elevated in June, with Middle East disruptions adding to existing strains.
1The Global Supply Chain Pressure Index (GSCPI) combines indicators such as shipping costs, delivery times, backlogs, and manufacturing activity. It is expressed in standard deviations from the historical average: 0 indicates average conditions, positive values reflect higher-than-normal pressure (more congestion, delays, or cost spikes), and negative values indicate below-average pressure or easing. Eg, a reading of +1.5 means global supply chain stress is 1.5 standard deviations above its long-run norm.
Among emerging economies, China’s trade surplus remains above $100 billion a month, whereas India posted a current account deficit of $2 billion in May 2026, versus a $0.7 billion surplus a year earlier, as surging imports outpaced exports. In Brazil, June’s trade balance recorded a surplus of $9.7 billion, up from $7.6 billion in May. However, the US has imposed 25% tariffs on Brazilian products, including furniture, ethanol, machinery, footwear, sugar, and other goods, starting July 22. Beef, coffee, aircraft, and other goods are exempt. Mexico’s trade surplus halved to $2.3 billion in May from $4.5 billion in April, driven by a sharp pullback in overall export activity. Effective July 24, the US implemented a targeted 10% tariff on approximately 20% of Mexican exports, applying specifically to goods that fall outside the 2020 United States–Mexico–Canada Agreement’s (USMCA’s) duty-free provisions, while explicitly exempting commodities already subject to Section 232 tariffs (including steel, aluminum, and automotive products).
Beyond these immediate geopolitical and macroeconomic pressures, attention is increasingly turning to a more structural force reshaping the global economy: AI. This disruption is manifesting itself in multifarious ways, not least on the markets where it is a major driver of stock valuations, trade flows, and investment decisions, but also in the wider economic sphere, where it is simultaneously remodeling the world of work and introducing a significant source of concern for workers worried about their jobs. AI disruption has become something of a double-edged sword, boosting stock prices for infrastructure providers and chip manufacturers while depressing the wider tech and knowledge sectors (now the “old-school economy”) with the threat of replacement by new insurgents.
So how healthy is the global economy? Every year, the McKinsey Global Institute takes stock of the world’s assets, liabilities, and wealth to create a global balance sheet—providing a lens into the world’s economic health. Published on July 23, the latest report, The global balance sheet 2026: Imbalance and divergence, estimates that the balance sheet reached nearly $1.8 quadrillion ($1,800 trillion) in 2025, up from $1.7 quadrillion a year earlier.
However, the report also finds that several asset classes have grown further out of balance with the underlying economy, notably in China and the US (the world’s two biggest economies). Significantly, this raises the possibility of corrections through inflation, asset valuation losses, or, optimally, productivity growth. The balance sheet’s mounting detachment from the global economy is underscored by US equity values soaring to 2.4 times corporate net assets, while profits have doubled their share of GDP since 2000. At the same time, China’s corporate debt grew to 80% of real assets, versus 50% globally. Government debt remains near all-time highs in the US, while it has grown most rapidly in China.
Meanwhile, global household wealth rose to a new high of $570 trillion, driven largely by “paper” gains, with just 20% attributable to real capital formation. In the US and Canada, equity values drove wealth growth, while China, France, and Germany saw a drop in paper wealth as real estate prices declined; inflation pushed up asset values in the UK and Japan.
Major economies have been on different pathways since the start of 2026. Although the US has seen a productivity acceleration, high public debt and equities introduce the possibility of sustained inflation or a balance sheet reset. Europe has drifted toward secular stagnation as sluggish demand depresses growth and interest rates, while China has experienced a partial balance sheet reset amid declining property values—although government spending and corporate investment have continued to propel balance sheet growth.
McKinsey’s Global Economics Intelligence (GEI) provides macroeconomic data and analysis of the world economy. Each monthly release includes an executive summary on global critical trends and risks as well as focused insights on the latest national and regional developments. View the full report for July 2026 here. Detailed visualized data for the global economy, with focused reports on selected individual economies, are also provided as PDF downloads on McKinsey.com. The reports are available free to email subscribers and through the McKinsey Insights app. To add a name to our subscriber list, click here. GEI is a joint project of McKinsey’s Strategy & Corporate Finance Practice and the McKinsey Global Institute.
ABOUT THE AUTHOR(S)
Arvind Govindarajan is a partner in McKinsey’s Boston office, where Krzysztof Kwiatkowski is a capabilities and insights expert; Shubham Singhal is a senior partner in the Detroit office; Sven Smit is a senior partner emeritus and senior adviser in the Amsterdam office; and Jeffrey Condon is a senior knowledge expert in the Atlanta office.
The authors wish to thank Nick de Cent, as well as Alejandro Morales, Beatriz Oliveira, Debdoot Ray, Frances Matamoros, Gabriel Marini, José Álvares, Masud Ally, Nikita S, Roman Büschgens, Sofía Córdoba, Tejesh Pradhan, Tomasz Mataczynski, Valeria Valverde, and Vanshika Tandon for their contributions to this article.
The invasion of Ukraine continues to have deep human, as well as social and economic, impact across countries and sectors. The implications of the invasion are rapidly evolving and are inherently uncertain. As a result, this document and the data and analysis it sets out should be treated as a best-efforts perspective at a specific point in time, which seeks to help inform discussion and decisions taken by leaders of relevant organizations. The document does not set out economic or geopolitical forecasts and should not be treated as doing so. It also does not provide legal analysis, including but not limited to legal advice on sanctions or export control issues.
Global Economics Intelligence executive summary, June 2026
Recently, global attention has been focused on two topics: the continuing uncertainty in the Persian Gulf and the outcome of the FIFA World Cup—both matters driving emotions among commentators, world leaders, and the public. Of the two issues, it will be the Gulf conflict that shapes global economic and, to some extent, political sentiment for the foreseeable future.
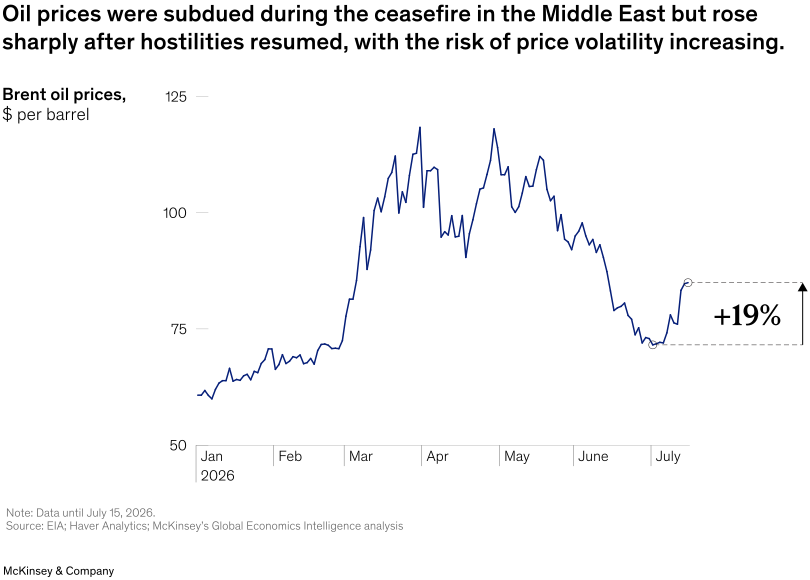
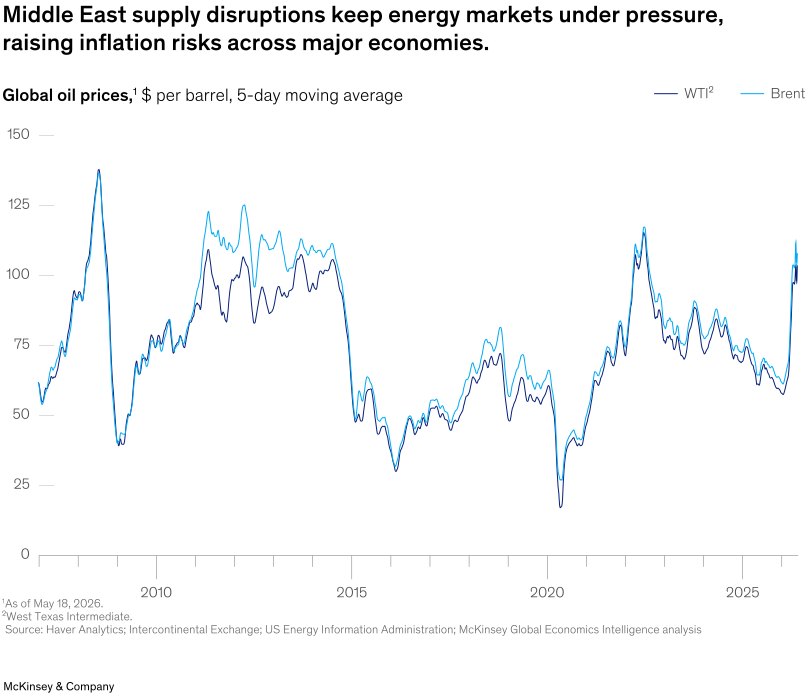
In past weeks, the price of oil spiked and then retreated toward $75 a barrel; however, more recent events in the Gulf have injected a fresh geopolitical risk premium into energy markets (Exhibit 1). The wider global economy now awaits the next developments in the Middle East conflict as the combatants trade rhetoric and military strikes while talks continue in the background. Meanwhile, Europe’s gas and heating-oil bills remain stubbornly high and, more widely, food inflation is starting to creep back up, with real prices climbing around 5% for vegetable oils and meat (though this rise is still far below the 2022 shock).
Among developed markets, inflation is drifting back to 2–4%, led by the United States where inflation reached 3.5% in June. The US consumer price index (CPI) increased 4.2% year over year in May, after rising 3.8% in April. Core inflation rose 2.9% (annualized). In May, median inflation expectations were down by 0.1 percentage points to 3.5% at the one-year-ahead horizon. Across most emerging economies, inflation has ticked up. CPI in China reached 1.2% year over year in May, while core inflation stood at 1.1%. At the factory gate, however, producer prices rose 4.1% year on year, following a 3.9% increase in May. In India, retail inflation rose to 3.93% in May (up from 3.48% in April) on higher food prices, reaching a 16-month high and the steepest rise recorded under the new CPI series (base year 2024).
Growth remains subdued in the face of geopolitical uncertainty, especially where energy prices are an issue. The euro area’s economy contracted by 0.2% quarter on quarter in Q1 2026—the first quarterly contraction since 2023—while growing only 0.3% year on year. The contraction reflects the cumulative drag from Middle East–driven energy prices, weakening external demand, and tighter financial conditions persisting across the bloc. Similarly, in the UK, recent data points to softer underlying activity following a relatively resilient Q1. Monthly real GDP fell by 0.1% in April, driven primarily by weaker services output. The Office for National Statistics has noted that firms in manufacturing, wholesale, and travel have cited ongoing Middle East tensions as a drag on activity.
So, what is sentiment like on the ground? Early June saw executives more downbeat on the economy than they have been in years, according to the most recent McKinsey Global Survey on economic conditions, which was conducted May 27 to June 5 (Exhibit 2). “Economic conditions outlook, June 2026” reported divided expectations for the coming months, with energy prices looming large in the minds of executives, alongside geopolitical instability. In this latest survey, a larger proportion of respondents also cited inflation and supply chain disruptions as top risks to the global economy.
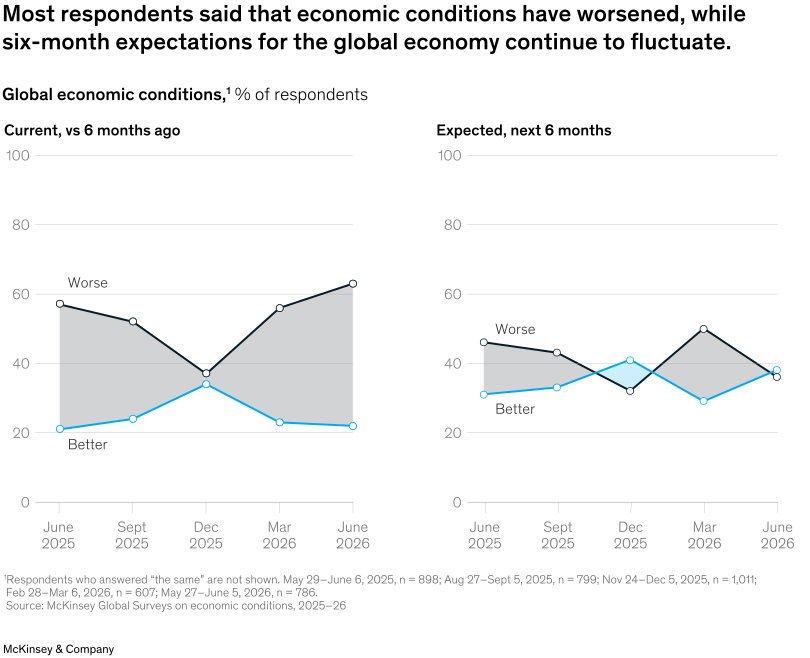
Nearly two-thirds of those surveyed said conditions in the global economy had worsened over the past six months (the largest share since June 2022), with a majority (54%) reporting worsening conditions in their national economies as well—notably, the largest share since respondents reflected on the COVID-19 pandemic’s early days in the September 2020 survey. That said, executives were less pessimistic about the global economy’s future than in the previous quarter. Respondents said their companies have been making defensive changes in response to external shocks.
In terms of consumer confidence, households are largely staying on the sidelines, with confidence continuing to deteriorate and no clear rebound recorded across major economies. At the same time, consumers are dividing into two camps globally, as Brazil, Russia, and the United States keep on spending while China, the eurozone, and the UK stall. In the US, retail and food services sales in May (adjusted for seasonal variation and holiday and trading-day differences) reached $763.7 billion, up 0.9% from April’s revised $757.0 billion. Nevertheless, consumer sentiment in the eurozone is showing early signs of a fragile recovery. The European Commission’s flash consumer confidence index improved for a second consecutive month in June, rising to –17.7 from –19.0 in May and recovering from a multiyear low of –20.6 in April, suggesting that households may be beginning to adapt to persistently elevated energy costs.
How are central banks reacting? The easing cycle has reached emerging markets first, with Brazil and Russia both making policy rate cuts—Russia and Brazil’s central banks both cut their key rates by 25 basis points to 14.25%—while the Federal Reserve and the Bank of England kept rates on hold. By contrast, the European Central Bank (ECB) raised all three key interest rates by 25 basis points in June—the first rate hike since September 2023. Accordingly, the interest rates on the deposit facility, the main refinancing operations, and the marginal lending facility were increased to 2.25%, 2.40%, and 2.65% respectively, effective June 17.
Looking ahead, we see that global growth is managing to maintain its footing with positive sentiment among executives reflected in both the global manufacturing (52.7) and services (52.0) purchasing managers’ indexes (PMIs), which are pointing to steady expansion. Factories in various economies continued to expand in May—notably in the US, UK, and India—while those in Brazil and Russia remained in the contraction zone. In the US, the industrial production index increased slightly to 102.6 in May, while S&P’s Manufacturing PMI climbed to 55.1 (54.5 in April).
Services sentiment, meanwhile, is telling two stories: India and China are powering ahead, while the UK, eurozone, and Russia remain stuck below 50.0. In the US, the services PMI eased to 50.7 in May (51.0 in April). India saw the services PMI slip to a 17-month low of 57.3 in June (from 59.8)—pulling the composite PMI to 57.4, its weakest level since March but still robustly in expansion territory.
Looking at employment, we see that US nonfarm payroll employment rose by 172,000 in May. Job gains were recorded in leisure and hospitality, local government, and healthcare. Employment in financial activities declined. Unemployment remained at 4.3%.
Overall, market volatility has been relatively modest despite the energy situation. The CBOE Volatility Index (VIX) has remained relatively low, near 20 (within the historical average range), while oil price volatility spiked to multiyear highs amid the Gulf conflict before retreating. Equity markets have headed in both directions, according to local economic sentiment: Japan and the US reached new highs while Russia (–8% in June) and Brazil experienced a sell-off. In May, the S&P 500 was up 5.2%, bringing the one-year return to approximately 29.8%; the Dow Jones climbed 2.9% over the month and posted approximately a 22.7% one-year return.
Similarly, government borrowing has seen bond markets diverge: Brazil’s 10-year rate topped 14% while China’s has been sinking toward 1.5%. Developed markets, meanwhile, anchored around 4%.
Turning to trade, we see that global export momentum remained uneven in the first few months of 2026, with growth concentrated in the United States, China, and Mexico, while import demand diverged across major economies, with strong growth in China, India, and Mexico. Meanwhile, global shipping activity softened in April, pointing to weaker trade momentum as geopolitical disruptions have persisted. Global supply chain pressures remained elevated in May, reaching the highest level since 2022. US-bound shipping rates from Shanghai rose modestly over April to May amid the renewed geopolitical disruptions; in the opposite direction, US-to-China freight rates rose in April but remained well below the elevated levels seen in 2025.
In the US, April’s exports reached $327.1 billion, up $8.3 billion on the March figures. April imports hit $383.0 billion, $7.6 billion more than in March. The monthly deficit decreased by 1.2% to $55.9 billion. May saw China’s exports reach RMB 2.59 trillion (about $382 billion) with imports at RMB 1.86 trillion (approximately $275 billion), producing a trade surplus of roughly RMB 724 billion, equivalent to about $105 billion.
Global geopolitical shifts call for a new “cartography of competitiveness”—that’s the conclusion of a June 30 report from McKinsey Global Institute. In a debate often characterized by vague calls for “cutting red tape” or “structural reforms,” Catalyzing competitiveness: Where investment happens and why makes the case for using productive investment as a proxy for competitiveness and it charts a detailed map of what investments happen where and why.
The research indicates that investment has stalled in Europe, shifted in the United States, and pulled away from the pack in China, with the divergence posing different challenges in each region. While Europe will need to close its €800 billion annual investment gap, the challenge for the US is to increase investment in manufacturing to reduce dependency on imports. Meanwhile, China is adding three times as many productive assets each year as Europe and the US combined, yet capital returns are roughly 40 percent lower. Cost differentials, time to market, and productivity levels are all influencing the overall picture. Rebalancing investment requires a boost in productivity and innovation, specialization in less cost-sensitive industries, and policies to level the playing field.
The authors conclude that restoring competitiveness where it is lacking will require real change from governments and companies on multiple fronts, and they make suggestions about potential ways forward.
McKinsey’s Global Economics Intelligence (GEI) provides macroeconomic data and analysis of the world economy. Each monthly release includes an executive summary on global critical trends and risks, as well as focused insights on the latest national and regional developments. View the full report for June 2026 here. Detailed visualized data for the global economy, with focused reports on selected individual economies, are also provided as PDF downloads on McKinsey.com. The reports are available free to email subscribers and through the McKinsey Insights app. To add a name to our subscriber list, click here. GEI is a joint project of McKinsey’s Strategy & Corporate Finance Practice and the McKinsey Global Institute.
ABOUT THE AUTHOR(S)
Arvind Govindarajan is a partner in McKinsey’s Boston office, where Krzysztof Kwiatkowski is a capabilities and insights expert; Shubham Singhal is a senior partner in the Detroit office; Sven Smit is a senior partner emeritus and senior adviser in the Amsterdam office; and Jeffrey Condon is a senior knowledge expert in the Atlanta office.
The authors wish to thank Nick de Cent, as well as Alejandro Morales, Beatriz Oliveira, Erik Rong, Frances Matamoros, Gabriel Marini, José Álvares, Roman Büschgens, Sebastian Vargas, Sofía Córdoba, Tomasz Mataczynski, Valeria Valverde, and Vanshika Tandon for their contributions to this article.
The invasion of Ukraine continues to have deep human, as well as social and economic, impact across countries and sectors. The implications of the invasion are rapidly evolving and are inherently uncertain. As a result, this document and the data and analysis it sets out should be treated as a best-efforts perspective at a specific point in time, which seeks to help inform discussion and decisions taken by leaders of relevant organizations. The document does not set out economic or geopolitical forecasts and should not be treated as doing so. It also does not provide legal analysis, including but not limited to legal advice on sanctions or export control issues.
Global Economics Intelligence executive summary, May 2026
Tensions in the Middle East, particularly the standoff in the Strait of Hormuz that has locked some vessels in the international waterway, continue to shape the markets, influence consumer and business behavior, and exercise the minds of central bankers and others charged with navigating current economic headwinds.
Energy prices are a key pressure point, settling at their highest level since 2022 across major energy commodity classes, although commodity markets more generally have been broadly stable. Gold prices have fallen as inflation concerns pushed yields higher and supported the dollar, reducing demand for the “yellow metal.” Industrial metals have also been affected, with aluminum and copper prices both rising. At the same time, rising vegetable oil prices have continued to push up the overall food price index, which has increased by 5% since February 2026. Meanwhile, higher crude oil and fertilizer prices are also adding upward pressure on global food prices.
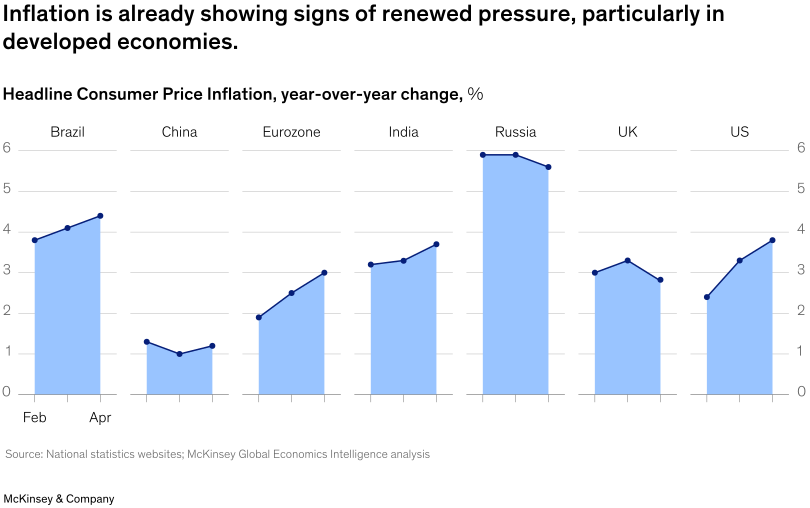
What is the knock-on effect on individual economies? Inflation has accelerated across all surveyed developed economies, driven primarily by higher energy prices. Inflation in emerging economies is broadly following the same trajectory, though inflationary pressures remain more visible at the producer level, with limited pass-through to consumers so far. Notably, inflation expectations have increased—both from the market as well as from a consumer perspective (Exhibit 1). In April, median inflation expectations in the US increased by 0.2 percentage points to 3.6% at the one-year-ahead horizon.
The US consumer price index (CPI) climbed 3.8% year over year in April, after rising 3.3% in March (Exhibit 2). Core inflation rose 2.8% (annualized). Headline consumer price inflation in the eurozone accelerated to 3.0% annually in April 2026. The rise was primarily driven by higher energy prices (up 10.8% annually), even after some countries implemented tax cuts to cushion consumers from the impact. Continued disruption is likely to push inflation further or keep price pressures elevated in the coming months even if spillover effects on core goods remain relatively contained at 2.2%. In the UK, inflation eased in April, with headline CPI moderating to 2.8% from 3.3%, largely reflecting lower household energy bills following the April Ofgem price-cap reduction and related government energy bill measures.
Global consumer confidence has fallen again, with the decline driven primarily by weaker sentiment in the UK. Across the pond in the US, the Consumer Confidence Index (Conference Board) edged down to 93.1 in May from an upwardly revised 93.8 in April. At the same, while retail sales have continued to grow in nominal terms across most countries, real growth is more subdued, as signs of stress start to emerge in some discretionary categories. In the US, April’s retail and food services sales (adjusted for seasonal variation and holiday and trading-day differences) were $757.1 billion, up 0.5% from March’s revised $753.4 billion.
All of which leaves central banks with a dilemma: whether to seek to hobble inflation by raising policy rates or to loosen their monetary stance to provide a stimulus. Accordingly, central banks mainly kept rates on hold in May, closely monitoring inflation risks before making further policy moves. However, the Bank of Mexico cut its policy rate by 25 basis points to 6.5% on May 8, while also announcing the end of the easing cycle that began in March 2024. Brazil too made a similar rate cut to 14.5% on April 29, citing uncertainty in the Middle East as one factor in its decision.
Meanwhile, Kevin Warsh was sworn in as Federal Reserve chair, succeeding Jerome Powell, whose term ended on May 15. Warsh previously served as a Fed governor from 2006 to 2011.
May 28 saw US real GDP growth revised down 0.4 percentage points to an annual rate of 1.6% in the first quarter of 2026, when the US Bureau of Economic Analysis (BEA) released a revised estimate. This compares with a real GDP growth of 0.5% in the fourth quarter of 2025. According to the BEA, the contributors to the first-quarter increase in real GDP were exports, investment, consumer spending, and government spending. Imports, which are a subtraction in the GDP calculation, increased. The downward revision for first-quarter growth primarily reflects changes to investment and consumer spending.
Growth remains potentially more challenging in Europe. Euro area (EA) GDP in the first quarter grew by 0.1% quarter on quarter and 0.2% year on year. Growth rates this quarter were relatively uniform across the largest EA economies. The European Commission has cut the 2026 eurozone GDP growth forecast to 0.9%, down from its previous 1.2% projection, while the International Monetary Fund anticipates 1.1%. Real GDP in the UK expanded by 0.6% quarter on quarter and 0.3% month on month in March, supported by stronger services activity and a rebound in manufacturing output. However, business sentiment deteriorated sharply later in May. Among emerging economies, Mexico’s GDP contracted by 0.6% quarter on quarter during the first quarter of 2026, but grew 0.4% annually.
Encouragingly, activity indicators find manufacturing and services sectors to be accelerating on a global basis, with output and new orders expanding—this despite rising prices and supply chain delays. Rising output and new orders were the main drivers of an overall increase in manufacturing purchasing managers’ indexes (PMI). In the US, the industrial production index increased slightly to 102.5 in April. S&P’s manufacturing PMI climbed to 55.3 in May 2026, from 54.5 in April. That said, respondents across services sectors reported that input prices are rising at an accelerated pace. In the US, the services PMI eased to 50.9 in May (51.0 in April).
Looking at employment, we see that US nonfarm payroll employment rose by 115,000 in April. Job gains were registered in healthcare, transportation and warehousing, and retail trade. Federal government employment continued to decline. Unemployment remained at 4.3%. In the UK, an interim report on young people and work by former minister Alan Milburn (released May 28) warns that one in six young people could be classified as NEET (not in education, employment or training) in the next five years unless urgent action is taken.
Financial markets remained volatile in May, with gains in Japan and the US offset by declines in parts of Europe and developing markets. Although market volatility eased slightly, it remained elevated, with oil markets still at above-average levels. In April, the S&P 500 was up 10.5%, bringing the one-year return to approximately 31.1%; the Dow Jones climbed 7.2% over the month and posted approximately a 24.2% one-year return. Rising inflation concerns pushed interest rates higher, as bond markets priced in tighter-for-longer monetary policy.
Subscribe
Receive an extended version of Global Economics Intelligence monthly in advance.
Across the globe, once-familiar trade patterns and strategic ties are being challenged by geopolitical tensions and regional conflicts, while international agreements are being reshaped. The world’s two largest economies, the United States and China, announced new trade commitments as part of President Trump’s state visit to China, which ran May 13–15. These included increased Chinese purchases of US agricultural products and restored market access for some US beef and poultry exports. The White House said China would purchase at least $17 billion per year in US agricultural goods through 2028.
Meanwhile, China has been seeking to strengthen trade relationships with multiple countries in the wake of last year’s Busan Summit in South Korea between Chinese leader Xi Jinping and the US president. January saw China and South Korea agree to significantly enhance cooperation around technology, trade, and transportation, while in the same month China and Canada announced lower tariffs on Chinese EVs and Canadian agricultural products. More recently, on May 1, China extended its zero-tariff treatment to cover all 53 African countries with which it has diplomatic ties.
On May 7, a week before the latest US–China summit, Brazilian President Luiz Inácio Lula da Silva met President Trump at the White House, where the two leaders discussed tariffs and trade plus other economic issues including rare earth metals, foreign policy, and combating organized crime and drug trafficking.
On May 19, the European Union finalized a trade deal with the US to stabilize the transatlantic economy. The EU will eliminate tariffs on US industrial goods in exchange for a 15% cap on US tariffs for most European exports. Notably, Mexico and the European Union agreed to modernize their global agreement signed in 2000, which originally focused on trade liberalization and political cooperation. The new agreement significantly broadens the scope of the partnership by reducing or eliminating remaining tariffs on agricultural and industrial products, improving market access for services and public procurement, and strengthening investment protections through updated dispute-settlement mechanisms.
India and Canada have successfully concluded a second round of negotiations for the proposed Comprehensive Economic Partnership Agreement (CEPA), while India and New Zealand signed a landmark free-trade agreement on April 27, aiming to deliver duty-free access for all Indian exports once the deal is ratified.
So, what is happening on the ground? Global export momentum has remained uneven in the opening months of 2026, with strong growth in China, Mexico, and the US. However, import trends diverged in early 2026, with growth in China, India, and Mexico, while US imports normalized from 2025 highs. Container trade volumes softened in April in the face of persistent geopolitical disruptions, while supply chain pressures rose to their highest level since mid-2022, amid prolonged shipping disruptions.
Looking at individual economies, we see that US exports for March reached $320.9 billion, $6.2 billion more than February’s exports. March imports were $381.2 billion, $8.7 billion more than in February. The monthly deficit increased by 4.4% to $60.3 billion. April saw cross-border trade (imports and exports) in China record a year-over-year growth rate of 18.7%, an acceleration from the 12.7% rise seen the previous month. Specifically, export growth accelerated to 14.1% in April, from 2.5% in March.
Meanwhile, import growth maintained a robust growth rate of 25.3%, similar to the pace seen in March (27.8%). Finally, India’s merchandise exports rose to $43.56 billion in April but imports also increased sharply to $71.94 billion, widening the trade deficit to $28.38 billion in April—this is attributable to disrupted global shipping routes and elevated freight and energy costs that have significantly impacted India’s import bill.
McKinsey’s Global Economics Intelligence (GEI) provides macroeconomic data and analysis of the world economy. Each monthly release includes an executive summary on global critical trends and risks, as well as focused insights on the latest national and regional developments. View the full report for May 2026 here. Detailed visualized data for the global economy, with focused reports on selected individual economies, are also provided as PDF downloads on McKinsey.com. The reports are available free to email subscribers and through the McKinsey Insights app. To add a name to our subscriber list, click here. GEI is a joint project of McKinsey’s Strategy & Corporate Finance Practice and the McKinsey Global Institute.
ABOUT THE AUTHOR(S)
Arvind Govindarajan is a partner in McKinsey’s Boston office, where Krzysztof Kwiatkowski is a capabilities and insights expert; Shubham Singhal is a senior partner in the Detroit office; Sven Smit is a senior partner emeritus and senior adviser in the Amsterdam office; and Jeffrey Condon is a senior knowledge expert in the Atlanta office.
The authors wish to thank Nick de Cent, as well as Alejandro Morales, Beatriz Oliveira, Erik Rong, Frances Matamoros, Gabriel Marini, José Álvares, Roman Büschgens, Sebastian Vargas, Sofía Córdoba, Tomasz Mataczynski, Valeria Valverde, and Vanshika Tandon for their contributions to this article.
The invasion of Ukraine continues to have deep human, as well as social and economic, impact across countries and sectors. The implications of the invasion are rapidly evolving and are inherently uncertain. As a result, this document and the data and analysis it sets out should be treated as a best-efforts perspective at a specific point in time, which seeks to help inform discussion and decisions taken by leaders of relevant organizations. The document does not set out economic or geopolitical forecasts and should not be treated as doing so. It also does not provide legal analysis, including but not limited to legal advice on sanctions or export control issues.
Global Economics Intelligence executive summary, April 2026
The Middle East conflict continues to dominate global energy markets. The closure of the Strait of Hormuz has disrupted a route that normally carries around 20 million barrels of oil per day and more than one-quarter of global seaborne oil trade. The UAE’s May 1 decision to leave OPEC adds another layer of uncertainty: While the immediate market impact may be constrained by the Hormuz disruption, the move could weaken OPEC’s longer-term market position.
The energy strain is currently feeding through to the broader commodity complex. Oil and gas prices remain elevated and volatile, with fertilizer and metals prices also coming under pressure. This matters because the shock is no longer only about energy supply; it is becoming a cost shock for producers and consumers. Manufacturing firms are facing higher fuel, transport, and input costs. Emerging economies are particularly exposed because higher energy prices often pass through into food prices, import costs, and household purchasing power more quickly. S&P Global noted that emerging-market manufacturing costs rose sharply in March as the Middle East conflict lifted fuel, transport, commodity, and dollar-denominated import prices.
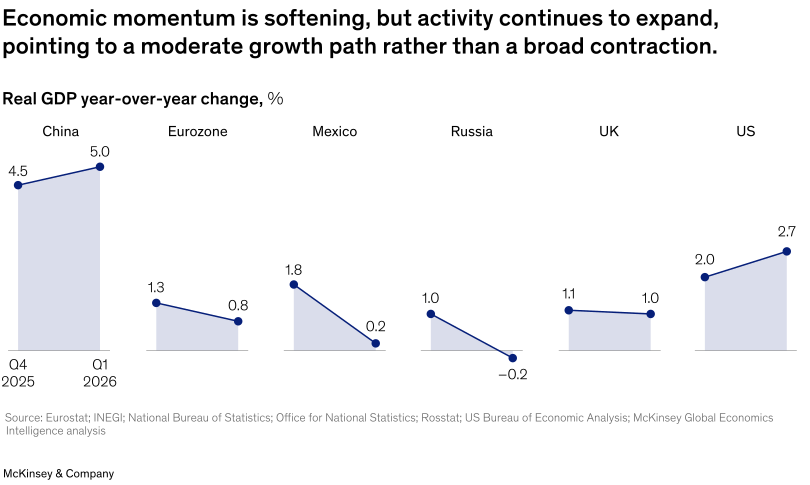
Real GDP in the US increased at an annual rate of 2.0% in the first quarter of 2026, up from the 0.5% posted in the fourth quarter of 2025. This real GDP increase reflects upturns in government spending and exports—and an acceleration in investment, partly offset by a deceleration in consumer spending. China was even more buoyant, reporting a resilient growth rate of 5.0% year on year for the first quarter of 2026, outpacing the fourth quarter of 2025 (4.5%). In contrast, global uncertainty has resulted in lowered GDP growth forecasts for the eurozone: Oxford Economics now expects just 0.8% this year (down by 0.2 percentage points compared with March), while the International Monetary Fund anticipates 1.1%.
Consumers may feel under siege: Higher prices are eroding real incomes while uncertainty is weighing on confidence. Retail sales and consumer spending may still look resilient in nominal terms—especially where energy prices lift total spending values—but the actual picture is weaker. In real terms, higher fuel and food prices are likely crowding out discretionary consumption, especially in energy-importing and lower-income economies. Nevertheless, in the US, the Consumer Confidence Index edged up to 92.8 in April from an upwardly revised 92.2 in March.
Nominal retail sales in March increased due to higher oil prices but, in real terms, overall consumer spending slowed significantly. In the US, March retail and food services sales in the US (adjusted for seasonal variation and holiday and trading-day differences) were $752.1 billion, down 1.7% from February’s revised $739.8 billion.
Inflation expectations are rising, especially at the five-year outlook, which reached almost 3%—levels last seen in 2022–23. March saw US median inflation expectations at the one-year-ahead horizon rise to 3.4% (from 3.0%), while expectations at the three-year-ahead horizon increased to 3.1%.
Consumer inflation has accelerated across the board, driven primarily by higher energy prices (Exhibit 1). Notably, consumers in emerging economies faced higher prices, driven not only by higher energy costs but also by rising food prices. Among developed economies, the US Consumer Price Index (CPI) was up 3.3% year over year in March, after rising 2.4% in February; core inflation rose 2.6% (annualized). Similarly, consumer price inflation in the eurozone climbed sharply to 2.6% annually in March, the highest rate since July 2024. The rise was almost exclusively driven by higher fuel prices, even after some countries implemented tax cuts to cushion consumers from the impact. Among emerging economies, retail inflation in India rose to 3.40% in March, a ten-month high under the new CPI series (base year 2024), and up from 3.21% in February. The rise reflected higher fuel costs and the West Asia conflict premium, especially in energy and transport, with food inflation firming to 3.87% after prior months of contraction.
Central banks are now caught between weaker growth and renewed inflationary pressure. Commentators indicate that the Iran war has paused the global easing push in April, with major central banks holding rates steady amid concern that higher oil prices could lift inflation expectations. Confirming this picture, it appears that most major central banks have adopted a “wait and see” posture, as the energy shock complicates the earlier easing narrative. Nevertheless, both Brazil and Russia cut interest rates further in April to boost domestic demand and economic activity. Russia cut its key rate to 14.5%, although its central bank noted that underlying price growth remains elevated and uncertainty is still high.
After a tumultuous March, in which crude oil volatility reached its second-highest level since 2008, April has seen financial markets rebound from the previous month’s sell-off; however, this rebound looks conditional rather than decisive. Global equity markets have recovered as investors priced in a greater chance of a de-escalation in tensions, but many remain below previous levels and continue to be volatile. The S&P 500 was up 10.5% in March, bringing the one-year return to approximately 31.1%; the Dow Jones rose 7.2% over the month and posted a 24.2% one-year return. During March, the CBOE Volatility Index (VIX), which aims to measure market risk and investor sentiment, spiked at 31.05 on March 27 but subsided to close at 16.9 in April. Meanwhile, the cost of capital has been moving sideways.
Gold prices have retreated from recent highs to below $4,700 an ounce, as safe haven demand became less one-way. Still, gold remains sensitive to the same forces driving the broader market: geopolitical risk, oil-linked inflation expectations, the US dollar, and prospects for interest rates.
Base metals prices reflect additional aspects of uncertainty. Copper rose on supply-related concerns and structural demand, while aluminum moved toward historical highs as Gulf supply disruptions and higher energy costs tightened physical markets. European aluminum billet premiums have risen sharply since the US–Iran conflict started, reflecting the region’s dependence on Gulf supply chains and the energy-intensive nature of aluminum production. Finally, higher oil and fertilizer prices are adding upward pressure on global food prices.
The activity data show the same tensions: Headline growth has not collapsed, but momentum is becoming more fragile (Exhibit 2). Both manufacturing and services purchasing managers’ indexes (PMIs) remained in expansion territory, but momentum softened as the Middle East conflict pushed up input costs, disrupted supply chains, and slowed growth in output and new orders.
Manufacturing has been supported in some markets by front-loaded orders, inventory rebuilding, and supply risk hedging, but services are showing clearer signs of demand weakness. The overall picture points to resilient but uneven industrial activity, with energy cost pressures and supply chain disruptions increasingly weighing on new orders and confidence. In the US, the industrial production index increased slightly to 101.8 in March, while S&P’s Manufacturing PMI climbed to 54.5 in April (52.3 in March). Meanwhile, India remains a standout with the HSBC India Manufacturing PMI rising to 55.9 in April from 53.9 in March, according to preliminary data.
March saw services momentum weaken across most major economies, with India and China still expanding solidly but the eurozone and UK barely above neutral. In the US, services activity expanded only marginally—with the services PMI rising to 51 in April (49.8 in March)—while new business fell for the first time in two years as the Middle East conflict and inflation hit demand. In the eurozone, services activity fell back into contraction in April; the services PMI dropped to 47.6 from 50.2 in March, as weak demand and higher energy costs weighed on firms. By contrast, India saw its services PMI firm to 57.9 in April, from 57.5 the previous month.
Global labor markets remain broadly resilient but are softening at the margins: Unemployment is still low or stable in the US and eurozone, while the UK shows weaker vacancies and higher unemployment than a year ago. US nonfarm payroll employment increased by 178,000 in March, the biggest rise in 15 months. Job gains were recorded in healthcare, construction, and transportation and warehousing, while federal government employment continued to decline. The unemployment rate changed little at 4.3%. In Asia, the picture is more uneven: India’s labor market remains broadly stable despite a small rise in unemployment, while China continues to face pressure from elevated youth unemployment and softer hiring demand.
Subscribe
Receive an extended version of Global Economics Intelligence monthly in advance.
Export growth remained broad based into early 2026, led by China, Mexico, and the US. Import trends diverged in early 2026, with growth in China, India, and Mexico but softer demand in Europe and the US. In early 2026, container throughput pulled back slightly from elevated levels amid geopolitical tensions. Supply chain pressures rose modestly in March, climbing above normal levels. In the US, exports reached $314.8 billion in February, $12.6 billion more than in the previous month. February imports reached $372.1 billion, $15.2 billion more than in January. The monthly deficit rose by 4.9% to $57.3 billion. China’s cross-border trade saw a robust rise in the first quarter, registering a year-on-year growth rate of 18.0%, compared with 3.4% in the fourth quarter of 2025. Specifically, growth in both exports and imports recorded double-digit expansion—at 14.7% and 22.7%, respectively—against 3.7% and 3.0% in the final quarter of last year.
What does it take to lead constructive partnerships between humans and AI agents at work? New McKinsey Global Institute (MGI) research indicates that AI could currently take on more than half of US working hours. However, while leaders herald the promise of AI, many employees also view it as a looming threat. So what do executives need to know to lead a human–agent hybrid team?
In an April 30 podcast, “The rise of the human–AI workforce,” McKinsey Senior Partner Alexis Krivkovich and MGI Partner Anu Madgavkar discuss new research on what AI can and can’t do, where humans will continue to add value, and what needs to happen to help all of us work side by side with agents and robots successfully.
The podcast follows up on the November 25, 2025, MGI report “Agents, robots, and us: Skill partnerships in the age of AI,” which challenged the “humans versus agents/robots” view and recast it as being a constructive partnership with these technologies. MGI research shows that, based on currently proven technologies and capabilities, more than half of current work hours could be automated, yet almost half of the work is beyond the capabilities of today’s technology. A lot of this work is cognitive, social, emotional, and interpersonal—and some of it is physical.
Moreover, as people adopt and use technology in workflows, business processes, and day-to-day activity, this creates new kinds of human work: for example, guiding, prompting, validating, refining, or building on what AI is doing. The new dynamic may also involve things that weren’t possible before but which we now have the technology to do, and to a higher quality: for example, much more R&D. Notably, in the case of many aspects of skills involving critical thinking—problem-solving, negotiation, conflict management, team management—humans will likely use AI but not be substituted by it.
McKinsey’s Global Economics Intelligence (GEI) provides macroeconomic data and analysis of the world economy. Each monthly release includes an executive summary on global critical trends and risks, as well as focused insights on the latest national and regional developments. View the full report for April 2026 here. Detailed visualized data for the global economy, with focused reports on selected individual economies, are also provided as PDF downloads on McKinsey.com. The reports are available free to email subscribers and through the McKinsey Insights app. To add a name to our subscriber list, click here. GEI is a joint project of McKinsey’s Strategy & Corporate Finance Practice and the McKinsey Global Institute.
ABOUT THE AUTHOR(S)
Arvind Govindarajan is a partner in McKinsey’s Boston office, where Krzysztof Kwiatkowski is a capabilities and insights expert; Shubham Singhal is a senior partner in the Detroit office; Sven Smit is a senior partner emeritus and senior adviser in the Amsterdam office; and Jeffrey Condon is a senior knowledge expert in the Atlanta office.
The authors wish to thank Nick de Cent, as well as Alejandro Morales, Beatriz Oliveira, Erik Rong, Frances Matamoros, Gabriel Marini, José Álvares, Roman Büschgens, Sebastian Vargas, Sofía Córdoba, Tomasz Mataczynski, Valeria Valverde, and Vanshika Tandon for their contributions to this article.
The invasion of Ukraine continues to have deep human, as well as social and economic, impact across countries and sectors. The implications of the invasion are rapidly evolving and are inherently uncertain. As a result, this document and the data and analysis it sets out should be treated as a best-efforts perspective at a specific point in time, which seeks to help inform discussion and decisions taken by leaders of relevant organizations. The document does not set out economic or geopolitical forecasts and should not be treated as doing so. It also does not provide legal analysis, including but not limited to legal advice on sanctions or export control issues.
Global Economics Intelligence executive summary, March 2026
With the Artemis moon mission capturing global imagination recently, it is perhaps no surprise that the space industry is among the sectors highlighted for their growth potential and recent performance in a new report from the McKinsey Global Institute (MGI). Over the past three years, 18 key industries, dubbed “future arenas of competition” by MGI, have grown roughly four times as fast as other industries in market capitalization and ten times as fast in revenue. These arenas are, by definition, the fastest-growing and most dynamic industries.
Among the top performers, AI software and services, cloud services, and semiconductors, plus digital advertising, cybersecurity, electric vehicles, space, and shared autonomous vehicles all show growth consistent with the assumptions underpinning MGI’s higher-growth scenarios. All 18 sectors showed the characteristic arena features of swift technological advances, a rapid influx of investment, and an expansive global market potential to sustain high growth over the next decade.
MGI has also coined the term “omniscalers” for a group of nine companies that are not only among the world’s biggest investors but also playing simultaneously across multiple arenas. Collectively, they generated over $700 billion in operating cash flow and invested more than $800 billion in R&D and capital expenditures during 2025.
According to the March 26 report “The race takes off in the next big arenas of competition,” companies headquartered in the United States and the Greater China region account for 90% of the arenas’ market value today. US companies lead in 14 and ten of the 18 arenas in market cap and revenue, respectively, while China is gaining ground, especially when measured by revenue shares.
Meanwhile, back on Earth, regional tensions are driving economic volatility. The situation in the Middle East has driven a surge in oil prices and heightened broader inflationary pressures. The American Automobile Association (AAA) reports that the average price of gasoline has risen to approximately $4 per gallon, up from $2.98 prior to the conflict. Other economies are likely to be harder hit, with the UK particularly vulnerable according to the OECD, which has cut its 2026 forecast for UK GDP by 0.5 percentage points—down from its previous estimate of 1.2%. At the same time, inflation is also predicted to be higher than expected.
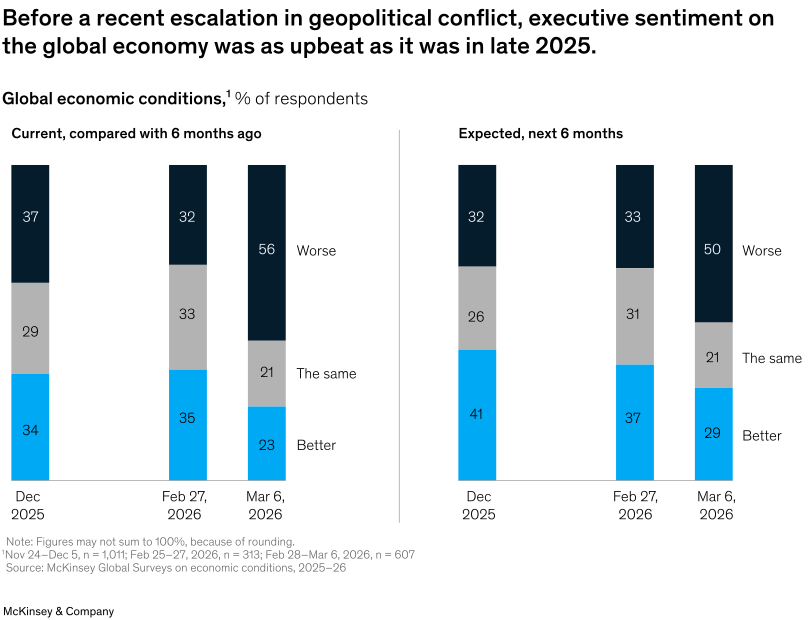
The latest McKinsey Global Survey tracking executive sentimenton the economy finds that geopolitical instability currently overshadows all other perceived economic risks (Exhibit 1). The survey was in the field when Middle East tensions escalated on February 28. Responses collected on and after that date were significantly less optimistic about both the global and domestic economies, although expectations for company growth remained primarily positive.
Unsurprisingly, energy prices have also become a significant focus (Exhibit 2). However, this was only seen in the responses received on and after February 28. For the first few days the survey was in the field, respondents were about equally likely to cite geopolitical instability and trade policy changes as a top risk to their countries’ economies, and energy prices weren’t a commonly cited risk. Then, geopolitical instability appeared as the predominantly cited risk, and energy prices became nearly as common a concern as trade policy changes.
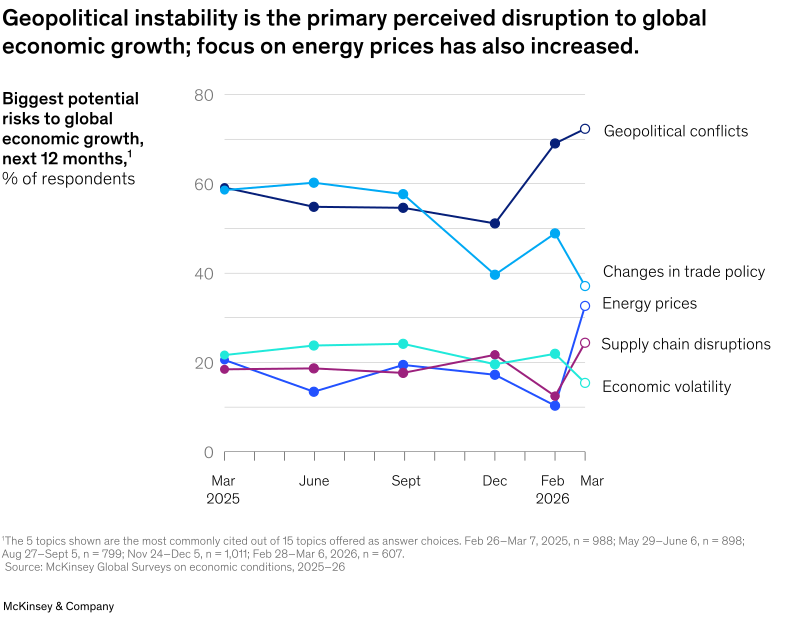
Nevertheless, respondents remain optimistic about expectations for their own companies, with just over half of private sector respondents expecting demand for their companies’ products or services to grow over the next six months—a similar figure to last quarter. About 60% expect profits to grow, consistent with the past two quarters, the survey found.
Subscribe
Receive an extended version of Global Economics Intelligence monthly in advance.
Moving to the growth figures, global activity remains subdued and uneven. US real GDP growth for the fourth quarter of 2025 was revised down sharply to an annualized 0.7%, while the European Central Bank (ECB) now expects eurozone GDP growth of just 0.9% in 2026. UK growth also remains weak, with GDP up only 0.8% year on year in January.
Among emerging economies, India continues to outperform but is beginning to show signs of moderation. Brazil’s economy expanded by 2.3% in 2025, down from 3.4% in 2024, while Russia recorded only 1.0% growth. Mexico’s economy grew 1.2% year on year in February, supported mainly by services.
Consumer sentiment remains subdued across most economies, even if retail sales have held up better than expected. Confidence improved modestly in the US but deteriorated in the eurozone and remained weak in the UK and Brazil. After a strong January, retail sales momentum appears to be fading in many economies, although UK retail sales still rose by 2.3% year on year in February, and China saw modest support from holiday spending and government incentives.
Central banks largely kept rates unchanged in March. The main exceptions were Brazil and Russia, both of which cut policy rates by 25 basis points in response to weaker growth and easing inflation.
Inflation pressures, however, are beginning to rise again. Energy prices linked to the conflict in the Middle East pushed inflation higher in several economies. Consumer inflation increased in the eurozone, India, and China, while inflation remained stubbornly above target in the UK and rose further in Mexico.
Commodity markets saw significant volatility in March. Brent crude rose 15%, natural gas 27%, gasoline 34%, and jet fuel more than doubled, driven by the closure of the Strait of Hormuz and concerns over global energy supply. The rise in energy costs also pushed up food and fertilizer prices, while gold briefly reached a record high before retreating.
At the same time, manufacturing activity strengthened globally, reaching its highest level in almost four years, driven mainly by Asia. China’s industrial production accelerated to 6.3% year on year, while manufacturing purchasing managers’ indexes (PMIs) in the US and China moved back into expansion territory. Services activity also remained relatively resilient, although momentum softened in India and Brazil.
Labor markets remain broadly stable. Unemployment has ticked up in the US and a few other countries but generally remains low. The UK unemployment rate was steady at 5.2%, while eurozone labor market conditions continued to hold up relatively well.
Financial markets weakened noticeably in March as investors reacted to higher energy prices and concerns over slowing growth. Equity markets declined across most economies, volatility rose sharply, and borrowing costs remained elevated.
Trade performance remained mixed. Export growth was strongest in the US, China, and Mexico, while import growth remained more uneven. The US trade deficit narrowed in January, Brazil’s trade surplus widened in February, and Mexico’s trade deficit narrowed sharply as exports rebounded.
McKinsey’s Global Economics Intelligence (GEI) provides macroeconomic data and analysis of the world economy. Each monthly release includes an executive summary on global critical trends and risks, as well as focused insights on the latest national and regional developments. View the full report for March 2026 here. Detailed visualized data for the global economy, with focused reports on selected individual economies, are also provided as PDF downloads on McKinsey.com. The reports are available free to email subscribers and through the McKinsey Insights app. To add a name to our subscriber list, click here. GEI is a joint project of McKinsey’s Strategy & Corporate Finance Practice and the McKinsey Global Institute.
Global Economics Intelligence executive summary, February 2026
All eyes are on the Middle East following an escalation of geopolitical tensions on February 28. Into March, global stock markets have wavered while oil and gas prices have risen following disruptions of petrochemical facilities and concerns over the potential blockage of key transportation routes through which ships normally pass each day carrying around a fifth of global oil supplies. At the same time, gold prices have jumped as investors seek a traditional safe haven. Recent economic volatility is in sharp contrast to the relative market stability experienced during the majority of February.
The IMF issued this statement on the situation in the Middle East on March 3: “We are closely monitoring developments in the Middle East. So far, we have observed disruptions to trade and economic activity, surges in energy prices, and volatility in financial markets. The situation remains highly fluid and adds to an already uncertain global economic environment. It is too early to assess the economic impact on the region and the global economy. That impact will depend on the extent and duration of the conflict.”
Meanwhile, growth among surveyed developed economies varies, topped by the US, where real GDP rose 2.2% in 2025 (2.8% in 2024) (Exhibit 1). This GDP expansion was supported by real consumer spending (up 2.7%) and real gross private domestic investment (up 2.0%). In the fourth quarter, real GDP rose 1.4%, down from the third quarter (4.4%), reflecting a decline in government spending and a deceleration in consumer spending. In Europe, eurozone GDP grew 0.3% quarter on quarter in fourth quarter 2025, matching the third quarter’s pace. Full-year 2025 growth reached 1.5%, the strongest growth rate in three years. The growth outlook for 2026 ranges from 1.1% (Oxford Economics) to 1.2% (ECB, European Commission), a slowdown from the previous year’s performance. Modest growth continued through year-end in the UK, where real GDP rose 0.1% month on month in December (0.2% in November). Growth in the three months to year-end was also 0.1%, driven by production, while services were flat and construction declined, leaving the expansion narrow. Full-year growth in 2025 was around 1.3%—slightly stronger than 2024 but still below the 1.5–2.0% prepandemic norm.
China’s government has set the country’s economic growth target for 2026 at around 4.5–5.0%. Meanwhile, Russia’s fourth quarter and 2025 full-year GDP growth was just 1% year on year, marking a slight pickup following a weaker third quarter. The full-year slowdown was broad-based, both across domestic and external demand. Labor shortages and strained capacity utilization limited the possibility of further increases in output, despite increased government spending and a widening deficit.
Consumer confidence generally remains subdued across economies, despite some improvement. In the United States, the Consumer Confidence Index (Conference Board) dropped to 84.5 in January, from December’s revised 94.2, its lowest level since May 2014. Meanwhile, UK consumer confidence edged higher but remains subdued. In Brazil, consumer confidence stayed below the neutral 100 mark, with FGV’s (Fundação Getulio Vargas) seasonally adjusted January reading slightly down at 87.3.
US retail and food services sales in December (adjusted for seasonal variation and holiday and trading-day differences) were $735.0 billion, unchanged at 0.4% from November’s revised $735.1 billion. The UK, meanwhile, was a standout with retail sales volumes rising 1.9% month on month and 4.5% year on year, the strongest monthly gain since mid-2024, after a broadly flat late-2025 pattern.
Subscribe
Receive an extended version of Global Economics Intelligence monthly in advance.
Most central banks kept their policy rates unchanged in February, although Russia cut rates mid-month by 50 basis points, to 15.5%.
Inflation eased across developed economies, though Europe’s slowdown was partly driven by base effects from energy prices; core inflation, however, remains more elevated. Among the emerging economies, India saw inflation pick up to 2.7% in January, while inflation in China remained close to 0% ahead of the Chinese New Year. Overall, inflation expectations have recently eased across both markets and consumers.
Looking at individual developed economies, the US consumer price index (CPI) rose 2.4% year over year in January, below December’s 2.7%. Core inflation was down to 2.5% (annualized). In January, median inflation expectations dropped at the one-year-ahead horizon to 3.1%, from 3.4%. Eurozone headline inflation decreased to 1.7% in January, from 2% in December. This drop was largely explained by a base effect in energy prices after a spike in January 2025. Core inflation fell modestly in January to 2.2%, benefiting from softer growth momentum in services prices. The disinflationary trend is expected to remain in place. Similarly, UK inflation continued to cool in early 2026, albeit at a higher level. Headline CPI inflation fell from 3.3% in December to 3.0% in January, while core inflation declined from 3.2% to 3.1%. Among emerging economies, India’s retail inflation rose to 2.75% in January, the first reading under the new CPI series (base year 2024) and up from 1.33% in December.
On the commodities markets, precious metals have continued their surge, with both gold and silver at historical highs (Exhibit 2). After a brief dip in early February, following the nomination of Kevin Warsh to chair the Fed, gold prices have continued to rise as buyers seek a hedge against market volatility, with a peak immediately after the US military action against Iran. Meanwhile, industrial metals have also seen recent rises amid supply-side disruptions and low inventories, pushing up copper and aluminum prices. Prior to the military action, energy prices had been rising slightly after OPEC reaffirmed a pause in oil production increases for March, while US natural gas prices spiked amid adverse weather. Oil and gas prices have been surging since the onset of the Middle East conflict. Food prices were broadly stable in January 2026.
In the early part of the year, manufacturing and services growth picked up as international flows stabilized and export orders edged down only marginally. However, manufacturing remains uneven globally, with contraction persisting in some economies, while others see renewed expansion as supply chains normalize and sectoral demand improves. In contrast, services sectors remain positive across the board.
The US industrial production index increased slightly to 102.3 in January. However, the February S&P Manufacturing PMI (purchasing managers’ index) fell to 51.2 (52.4 in January), the lowest in seven months. It was a somewhat bright start to the year for the UK with flash surveys suggesting activity is moving into mild expansion with the composite PMI at 53.9 in February—its highest level since April 2024.
Among emerging economies, the HSBC India Manufacturing PMI rose to 56.9 in February 2026 from 55.4 in January, preliminary data showed. The reading signaled stronger operating conditions and marked a robust expansion, supported by sustained growth in output and new orders. In Mexico, recent PMI data indicate continued weakness in the manufacturing sector. The manufacturing PMI rose slightly to 46.3 in January, from 46.1 in December, but stayed below the 50.0 neutral threshold, signaling ongoing contractionary conditions. Factories faced their steepest drop in orders in seven months, triggering operational cutbacks. Export orders remained in contraction amid softer US demand, but there were signs that this may be moderating.
Looking at the latest services data, we see that the US services PMI was down to 52.3 in February (52.7 in January)—but still in the expansion zone. Similarly, in India the services PMI eased to 58.1 in February, from 58.5 the previous month.
US nonfarm payroll employment increased in January (+130,000); job gains were seen in healthcare, social assistance, and construction, while federal government and financial activities shed jobs. The unemployment rate changed little at 4.3%. Meanwhile, in the UK, the labor market is loosening incrementally. Unemployment rose to 5.2% (October–December) from around 4% in 2023–24, while the claimant count edged up to 4.4% in January. Employee numbers have also drifted lower into early 2026. On the demand side, vacancies remain around 725,000 after a prolonged decline.
In Brazil, the three-month moving average unemployment rate edged toward 5.1% in January, compared with December’s 5.2%. Similarly, in Mexico, unemployment inched down to 2.6% in December, from 2.7% in November. Formal employment trends point to weakening labor demand, declining from 22.8 million to 22.5 million registered jobs, with 320,692 formal jobs lost in December.
Equity markets were broadly stable throughout February, with Brazil and Japan outperforming as foreign investor inflows supported gains. However, volatility picked up across multiple markets. The cost of capital moved sideways in February.
Export growth broadened in 2025, led by Mexico and the US, with China strong and Europe stabilizing. Last year’s imports growth presented a slightly different picture, reflecting resilient emerging markets and US demand, but weaker momentum in China.
Seaborne trade softened into late 2025, with total volumes easing and container throughput cooling after midyear strength. At the same time, logistics conditions remained broadly normal in late 2025, with a slight uptick in supply chain stress in December. Inbound spot freight rates continued to normalize into 2026 from mid-2025 highs, while outbound freight rates to Shanghai eased after a June spike and stabilized going into the year-end.
On February 20, 2026, the US Supreme Court ruled that reciprocal tariffs imposed under the International Emergency Economic Powers Act exceeded presidential authority, in a 6–3 decision that removed President Donald Trump’s authority to impose tariffs without Congressional approval. In response, the administration announced import surcharges under Section 122 of the Trade Act of 1974 to replace the invalidated tariffs. US exports in December reached $287.3 billion, $5.0 billion less than in November; imports were $357.6 billion, $12.3 billion up on November. The monthly deficit rose 32.6% to $70.3 billion.
In the eurozone, meanwhile, net exports will remain under pressure from US tariffs, competition with Asian economies, and still uncertain global demand. The EU and India have signed a free trade agreement after many years of negotiations. In the UK, the trade deficit narrowed into year-end, with a goods shortfall partly offset by a stronger services surplus, though structural improvement remains limited.
Among emerging economies, India’s merchandise trade deficit widened significantly to $34.68 billion in January 2026, due to $71.24 billion in imports and $36.56 billion in exports, driven by surging gold, silver, fertilizers, and electronics imports. Brazil’s January trade balance posted a surplus of $4.3 billion, down from $9.3 billion in December. Mexico posted a $2.43 billion trade surplus in December 2025, with both exports and imports rising. The surplus was driven by stronger non-oil exports, particularly manufactured goods, which expanded faster than imports despite a decline in oil export values.
McKinsey’s Global Economics Intelligence (GEI) provides macroeconomic data and analysis of the world economy. Each monthly release includes an executive summary on global critical trends and risks, as well as focused insights on the latest national and regional developments. View the full report for February 2026 here. Detailed visualized data for the global economy, with focused reports on selected individual economies, are also provided as PDF downloads on McKinsey.com. The reports are available free to email subscribers and through the McKinsey Insights app. To add a name to our subscriber list, click here. GEI is a joint project of McKinsey’s Strategy & Corporate Finance Practice and the McKinsey Global Institute.
Global Economics Intelligence executive summary, January 2026
After a year dominated by concerns over trade and global turbulence, businesses are entering 2026 with more optimism—despite continued uncertainty. Indeed, business sentiment was more buoyant in the final quarter of 2025 than in previous quarters, according to the recent McKinsey Global Survey on economic conditions.
Executives were more upbeat about future economic expectations than they had been in previous 2025 surveys, with respondents expressing the brightest near-term expectations of the year—this in comparison with three previous quarters of largely negative assessments of current global economic and trade conditions (Exhibit 1). Moreover, for the first time in 2025, the survey recorded more respondents predicting improvement over the following six months versus those expecting worsening conditions.
Notably, survey respondents no longer see changes in trade policy as the foremost disruptor of business, although this remains a significant concern. Instead, they point to geopolitical instability as the principal risk. Investment in AI and gen AI continues to be the most reported high priority for business leaders to address, particularly in technology, media, and telecommunications and in service industries.
There is further optimism in the IMF’s January 2026 World Economic Outlook update: The IMF is projecting global growth at 3.3% for 2026 and 3.2% for the following year, a slight upward revision from the October 2025 update (Exhibit 2). It says that technology investment, fiscal and monetary support, accommodative financial conditions, and private sector adaptability have helped to offset trade policy shifts. At the same time, it warns that policymakers should restore fiscal buffers, preserve price and financial stability, reduce uncertainty, and implement structural reforms.
Looking back on 2025, we see that the year was one of mixed fortunes for economies around the world. The US economy grew strongly in 2025, with real GDP accelerating through midyear on higher consumer spending and exports. GDP for the third quarter of 2025 rose by 4.3% (annual rate) versus 3.8% in the second quarter. The real GDP increase reflected higher consumer spending, exports, and government expenditure that were partly offset by a decrease in investment. Meanwhile, the Chinese economy grew by approximately 5.0% in 2025, and India expanded by some 6.5% on an annual basis on the back of resilient services activity and domestic demand. By contrast, eurozone growth is expected to be 1.4% in 2025, while UK real GDP expanded in November, driven primarily by a rebound in production sectors, but remains modest.
In the US, consumer sentiment is trending down, dropping to 89.1 in December from November’s revised figure of 92.9. Nevertheless, November’s retail and food services sales (adjusted for seasonal variation and holiday and trading-day differences) were $735.9 billion, up 0.6% from October’s revised $731.4 billion. Overall, retail sales continue to grow across most countries, with some acceleration observed in November and December due to the holiday season.
Against this backdrop, central banks have been cutting interest rates to stimulate their economy, where they feel they have room for maneuver. Although central banks in Brazil, China, and the eurozone refrained from cutting rates, other major central banks delivered 25-basis-point cuts in December.
Subscribe
Receive an extended version of Global Economics Intelligence monthly in advance.
Looking at prices, we see that inflation across developed economies remained broadly stable in December. Among the emerging economies, inflation in India and China picked up from near zero, while in Brazil and Russia it continued to decelerate. Overall inflation expectations have been oscillating around 2.2%.
In the US, in December, median inflation expectations increased at the one-year-ahead horizon, to 3.4% (from 3.2%), but remained steady at the three-year-ahead and five-year-ahead horizons—both at 3.0%. The consumer price index (CPI) increased 2.7% year over year in December—the same pace as November—while core inflation was slightly up, to 2.6% (annualized). Among other developed economies, eurozone inflation is lower, with the headline figure projected to decrease from 2.1% in 2025 to 1.9% in 2026 and 1.8% in 2027, before rising to 2.0% in 2028, mainly owing to energy inflation. Meanwhile, UK CPI ticked up to 3.2% in December, while core inflation was slightly higher at 3.3%, indicating that underlying pressures have moderated from postpandemic peaks but are not yet fully contained.
Among the emerging economies, the picture is also mixed. In China and India, inflation is low or negative. Consumer prices in China continued their recovery to 0.8% in December (0.7% in November), while core CPI was unchanged at 1.2%. Deflation in producer prices continued to ease slightly to –1.9% in December, from –2.2% in November. In India, CPI inflation was recorded at 1.33% year on year in December 2025 (provisional), while food inflation remained in contraction at –2.71% year on year. However, it’s a different story in Russia, where tight monetary policy is still required to achieve the Central Bank of Russia’s inflation target of 4%. Recently, inflation has slowed to 7% in November and 6% in December but a rise in VAT and regulated prices for municipal services will create upward pressure and has already started to boost expectations. In Brazil, inflation is more modest, touching 4.26% in December (versus 4.46% in November) and coming in below the central bank’s upper target limit of 4.50% for a second consecutive month. Mexico’s annual inflation declined to 3.7% in December, down from 3.8% in November, reinforcing the ongoing disinflationary trend.
On the commodities markets, gold exceeded $5,000 per ounce—a level never seen before—before cooling somewhat. At the same time, oil prices have eased as supply increased and demand remained broadly stable, with only modest growth expected in 2026. Food prices have also eased, driven mainly by dairy prices, which declined on seasonal increases in cream and milk availability.
Both manufacturing and services indicators ended the year on a weaker note, as growth rates of new orders and output eased. Manufacturing sectors around the world are either contracting or slowing down; companies do not see growth in new orders or employment, while stocks of purchases are declining. In parallel, services growth eased across most countries at the end of 2025. However, companies remain positive about 2026.
The US industrial production index decreased slightly to 102.3 in December. Similarly, S&P’s Manufacturing PMI fell to 51.8 in December 2025 (52.2 in November), the lowest in five months. However, in the eurozone, despite a marginal decline in the Economic Sentiment Indicator and the composite PMI at the end of 2025, the industrial production index is gradually improving. In India, business surveys pointed to continued expansion but moderating momentum as 2025 ended. The HSBC India Manufacturing PMI eased from 56.6 in November to 55.0 in December (still comfortably in expansion), indicating growth but at a slower pace amid competitive pressures and softer sales in some categories. In Brazil, manufacturing production has dropped: The monthly Industrial Production Index (IPI) decreased from 113.04 in October to 103.4 in November (although still above the neutral 100 line). The Mexico Manufacturing PMI fell from 47.3 in November to 46.1 in December, signaling a further deterioration in operating conditions.
On the services front, the US services PMI edged down to 52.5 (54.1 in November). Services activity in India also cooled but remained strong: The HSBC India Services PMI was at an 11-month low of 58.0 in December (down from November’s 59.8) as new business growth softened, while export demand held up better. Brazil’s Monthly Services Survey (PMS) revenue index slid slightly to 127.7 in November from 128.7 in October (staying above the neutral 100 line). This was mirrored in the volume index, which declined to 111.1 (from 112.8).
US total nonfarm payroll employment increased in December (+50,000) but has shown little change since April. The unemployment rate remained at 4.4%. Across the pond, the number of paid employees in the UK has been trending lower since 2024, while unemployment has remained broadly stable at 5.1%, with a renewed rise among workers aged over 50. In China, the overall surveyed urban unemployment rate stuck at 5.1% for a third consecutive month. The youth unemployment rate eased slightly to 16.5% in December (16.9% in November). Labor market conditions displayed mixed signals in Mexico. The unemployment rate rose to 2.7% in November, up from 2.6% in October. At the same time, formal employment reached a record high, with 22.8 million registered jobs in November.
Equity markets globally started 2026 on a strong note, with indexes rising and reaching record highs in most economies. The cost of capital moved sideways in January.
Export growth strengthened across most major economies through October 2025, while import growth was mixed over this period. Total seaborne volumes softened into November, while container throughput cooled after midyear strength. Logistics conditions remained broadly normal in November, with a modest uptick in global supply chain stress in December. Inbound spot freight rates also ticked up in December but remained well below mid-2025 highs. Outbound freight rates to Shanghai eased after June’s spike and stabilized into year-end.
In the US, the monthly deficit fell by 39.0% to $29.4 billion in October. Exports reached $302.0 billion, $7.8 billion more than in September, while October imports reached $331.4 billion, $11.0 billion less than in September. In China, cross-border trade (imports and exports) experienced a year-on-year growth rate of 6.2% in December, a rebound from the 4.3% increase seen the previous month. Export growth accelerated to 6.6% in December, from 5.9% in November, while imports also witnessed a recovery to 5.7% from November’s 1.9%. Mexico posted a trade surplus of US $663 million in November, as imports declined slightly more than exports, resulting in a positive balance despite a broad monthly contraction in trade flows.
A bold new book from the McKinsey Global Institute supports an optimistic view of progress and economic development over the coming decades. A Century of Plenty: A Story of Progress for Generations to Come (McKinsey Global Institute, January 2026) imagines a world in which every person enjoys at least Switzerland’s standards of living today—a hypothesis that the authors stress tested and concluded is physically possible.
McKinsey’s Global Economics Intelligence (GEI) provides macroeconomic data and analysis of the world economy. Each monthly release includes an executive summary on global critical trends and risks, as well as focused insights on the latest national and regional developments. View the full report for January 2026 here. Detailed visualized data for the global economy, with focused reports on selected individual economies, are also provided as PDF downloads on McKinsey.com. The reports are available free to email subscribers and through the McKinsey Insights app. To add a name to our subscriber list, click here. GEI is a joint project of McKinsey’s Strategy & Corporate Finance Practice and the McKinsey Global Institute.